Carbon Emissions based on Carbon Monitor Data

Carbon dioxide (CO2) emissions from the use of fossil fuels and the production of cement are the main driving force of climate change. Carbon Monitor is an international initiative providing for the first time regularly updated, science-based estimates of daily CO2 emissions. The data reveal the drop and re-growth of emissions during the COVID-19 pandemics.”
CarbonMonitor is available only on countries where data is available freely and it’s operating directly by the laboratories consortium (CEA-LSCE, UCI, Tsinghua University) without specific adaptations for each territory. In partnership with Atos for dedicated customers, the service can be implemented anywhere and running in real-time if data sources are also available in real-time. In this case the service will be operated specifically for the customer for its own usage with dedicated reports.
The service could be extent to IoT data to offer a Global and a Local analyze at the same time.
Methane will be implemented in the next months or on demand.
We own data for :
In this interface, you can compare CO2 emissions depending on the sector, the date (year, month), or both of these factors.
Comparison by sector (doughnut graph) :
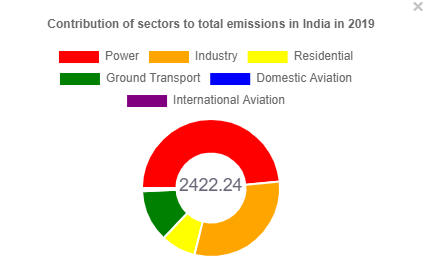
You'll see the part of each sector in the global emission of the country (during the year you chose). Inside the doughnut graph, the number is the total emissions of the country during the year.
Comparison by date (bar graph) :
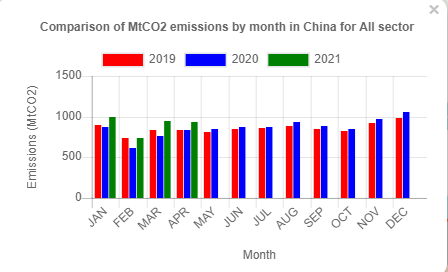
You'll see the comparison by month on the 3 years of data we own, depending on the sector you chose.
Comparison by date and sector (bar graph) :
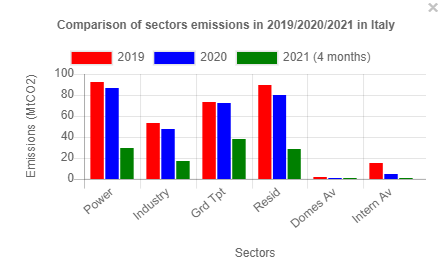
You'll see the comparison of each sector, on the 3 years of data we own (there is only four month in 2021).